
Generative AI is a platform shift that promises to fundamentally change software. But what makes GenAI so powerful—including its non-stationary and non-deterministic nature—also makes its behavior that much more complex to understand and manage, especially at scale.
Today’s GenAI apps often contain multiple moving parts that each have their own data and non-determinism. Attributes like endpoint consistency, endpoint refactor consistency, retrieval efficacy, embedding pipeline efficacy, and components related to agents require that AI teams rely on adaptive tools to gain clarity on where a shift in behavior has occurred and how to address it. A more comprehensive, adaptive way of understanding this is needed.
Distributional is an adaptive testing solution for enterprise AI applications, built to help teams define, detect, understand, and improve upon an application’s desired behavior. In this article, we’ll review the four key concepts within Distributional to help you gain an understanding of how the platform works, including: Scale, Metrics, Tests, and Results. To learn more, download the paper on Distributional’s User Experience or visit our docs.
Distributional concepts
Distributional is designed to handle scale and complexity. Our architecture automatically scales batch analysis of underlying LLM data, and our tests are designed to translate unstructured data into quantitative analysis that scales with usage of your AI applications. Both are designed to handle the full complexity of your application, testing and analyzing data for every component to make root cause analysis faster and more effective.
Scale
We designed this workflow to help you scale testing and analysis of Generative AI applications in production. It is not a workflow designed for rapid iteration and prototyping in development—there are plenty of open source libraries with this workflow.
You should start using Distributional when you already feel okay about the performance of your LLM application, using our solution to robustly define this baseline behavior and then continuously assessing drift from this baseline expectation. Our goal is to give you insights to production usage and performance of your AI application as part of a continuous testing, analysis, and development process.
Metrics
Distributional’s approach to metrics is the more the merrier. When you point our platform at your GenAI application production logs, our Eval Module automatically generates dozens of statistical and LLM-as-a-Judge metrics to transform this unstructured data into testable quantities.
Our goal with this library is to expand the number of quantities you are automatically testing so you have a broader, more robust definition of overall AI app behavior. By expanding the number of metrics, the idea is that a wide variety of weak estimators will give you a more durable assessment of change in performance over time, rather than a few narrowly defined evals. We do, however, recommend that you also upload any evals you have constructed, so you can observe these in the context of the wider variety of metrics the Distributional platform provides.
The benefit of this approach is that you can discover correlations across these metrics that may yield interesting insight on AI app behavior that you can use to continuously evolve your application. These metrics and the actual underlying unstructured data from every component form columns in our platform.
Tests
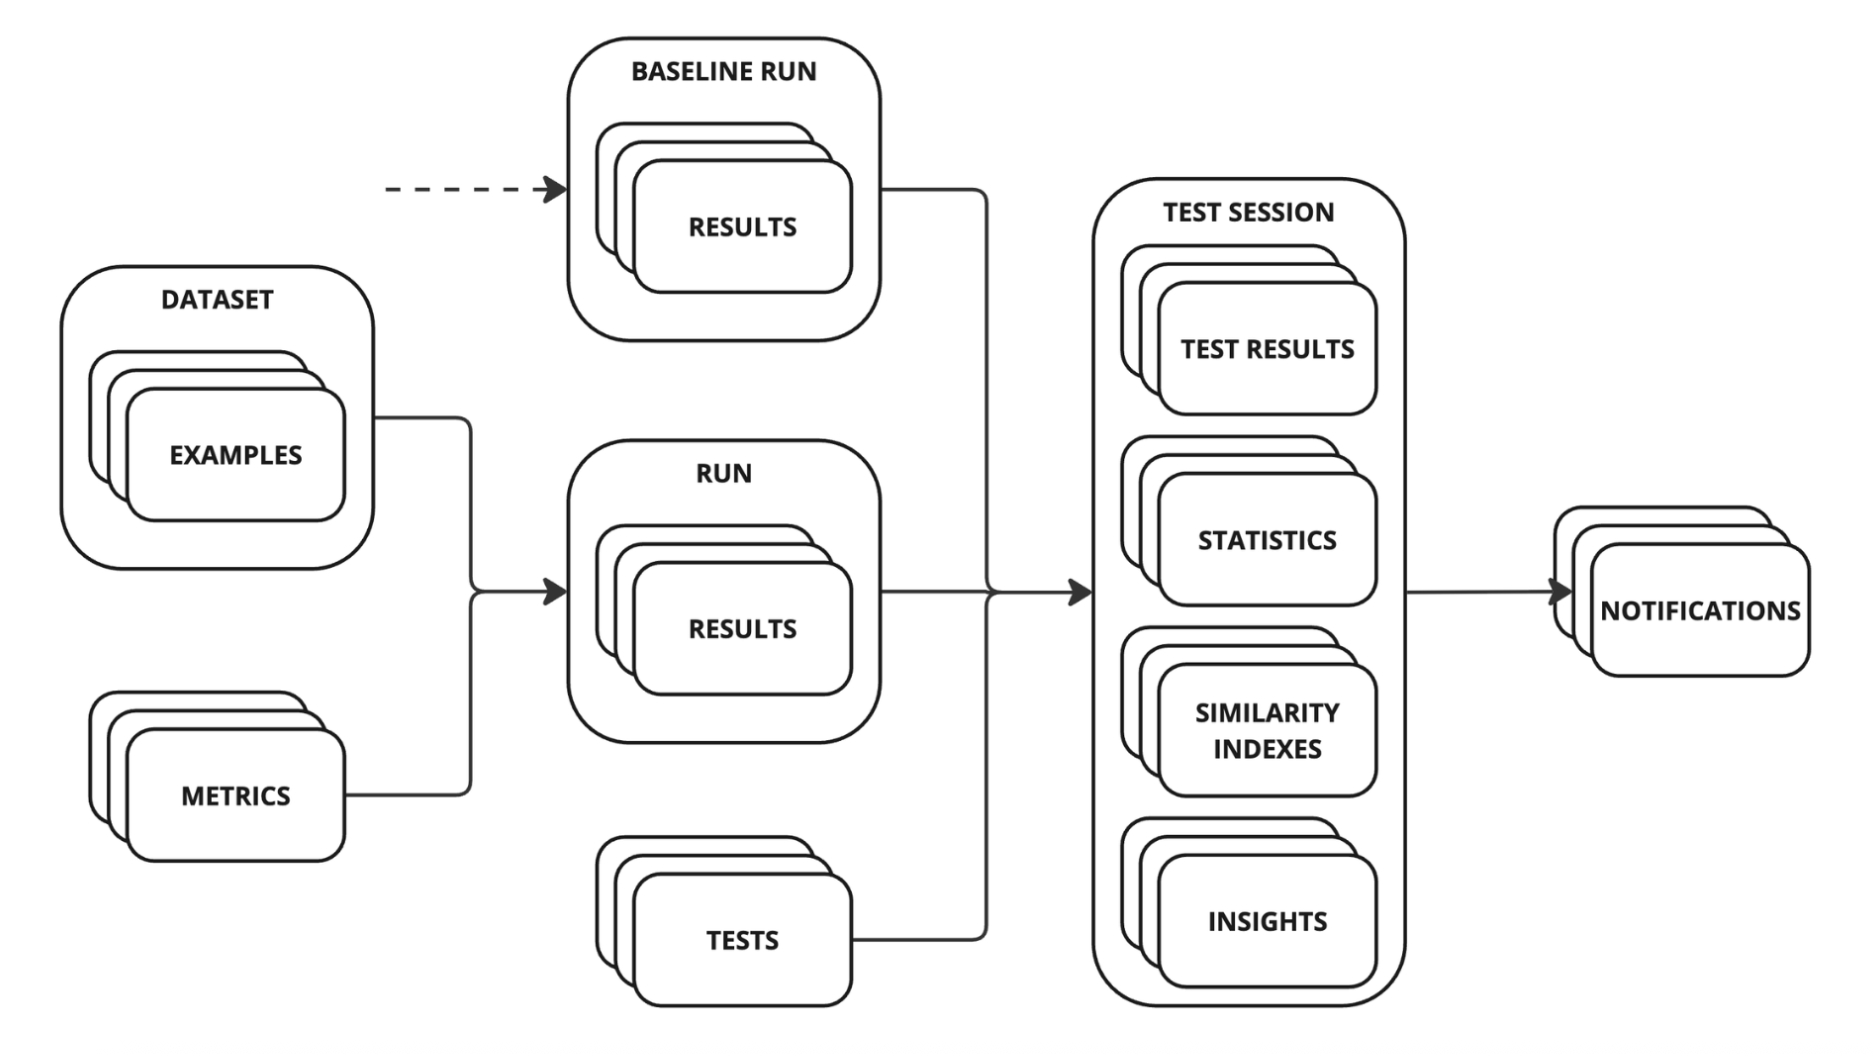
After computing metrics from runs, the Distributional platform automatically applies statistical tests to compare the distribution of these metrics in the baseline run versus the experiment run. These tests are usually designed to assess similarity over time where the baseline run is day zero or day t-1 and the experiment run is today. They can also be designed to compare model version A as experiment versus model version B as the baseline. The goal of these statistical tests is to assert a threshold level of consistency run-over-run.
Our product contains over 60 statistical tests that can be applied programmatically or with a click of a button. But to simplify the initial user experience, we start with a single test for similarity using our Similarity Index (Sim Index). This approach means that you will start to get insights on shifts in AI app behavior without having to do any work designing your own tests or parsing each of these dozens of statistical tests. Instead, as you learn how the Sim Index is changing over time, this is an opportunity for you to apply any one of these dozens of statistical tests with a single click of a button.
The advantage of this approach is that it also scales. You can observe our Sim Index on every component of a complex agent or RAG system to understand which component is driving change. You can also view our Sim Index at the Run level across every application to understand which may need more attention.
Results
Our Similarity Report provides an overview of the Similarity Index for all metrics, giving you a quick view into what has changed so you can assess whether there is anything of note. The idea with this Report is that it should enable AI product teams to get on the same page, and also give that team a view to share with governance or leadership teams that need information on what has been tested but may not have complete AI application context.
Bundled with this Report are Similarity Insights, which are our platform’s assessment of which changes are most impactful, and where you should focus your attention when starting to diagnose the issue. These Similarity Insights translate statistical tests into human readable insights on the drivers of this change.
Finally, we also automatically offer Notable Results that feed you specific rows of data that are most important to prioritize when performing root cause analysis. This eliminates the need to sift through rows of data or randomly sample it to try to get intuition on the user experience. Instead, you get a direct signal on which traces are most important to review.
These insights—Similarity Index, Similarity Insights, and Notable Results—are designed to provide an intuitive workflow to quickly understand what has changed, what is driving it, and whether you care.
Learn more
For a deeper dive into Distributional concepts and to learn more about how to use Distributional, check out the downloadable paper on Distributional’s User Experience.
Subscribe to DBNL
Thank you for your submission!
Oops! Something went wrong while submitting the form.
.jpg)